How Zohran Mamdani won, in four charts
This was an extremely unusual and exciting election
I want to start by issuing a mea culpa for my previous take that Zohran Mamdani was extremely unlikely to win the 2025 NYC Mayoral Democratic primary. I still stand by my view that Mamdani was a priori a poor choice to rally behind if your main goal was beating Cuomo, and that strategy is still very important in RCV elections, but like many people I underestimated Mamdani’s potential and was overconfident in my assessment of his chances.
So how did Mamdani pull it off? He created something the left has talked about for decades but has rarely, if ever, actually achieved: a massive youth surge in turnout. I’ll have more to write about regarding that youth turnout surge once the final voter file data is in, but for now here are four charts that show how Mamdani became the Democratic nominee for Mayor (caveat that not all the votes are done counting yet).
1) Mamdani grew the left’s vote share across the city
You may remember Maya Wiley, left-wing New Yorkers’ standard-bearer four years ago who got 21.4% of the vote and ultimately came third in RCV. As expected, the vast majority of her voters flowed to Mamdani this time around, but what’s impressive is how he got a higher share of than vote than her in almost every part of the city, and in some cases much much higher. You can particularly see his surge in support in the heavily Asian & Hispanic parts of Queens and Brooklyn — these are two groups Wiley did very poorly with yet Mamdani may well have won both.
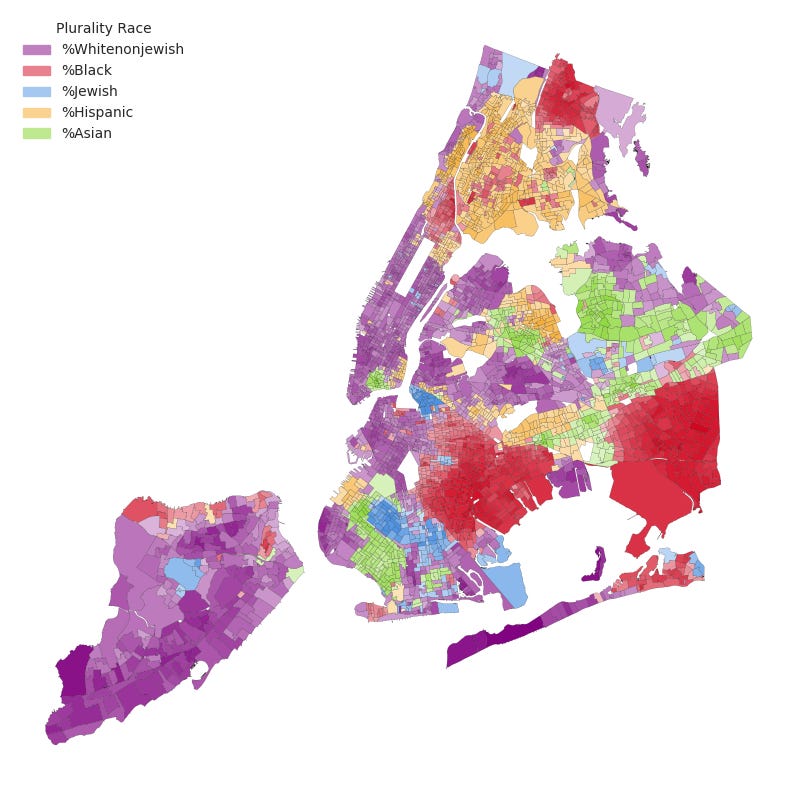
(Here’s a bonus map my colleague iabvek made showing the estimated race/ethnicity of 2021 Democratic primary voters, which may be helpful for interpreting the above map)
Of note are the few areas where Mamdani only a little better than Wiley. Most salient are the heavily Black areas, you can see these in South-East Brooklyn, South-East Queens and the North Bronx. This isn’t terribly surprising given that Wiley is Black and Mamdani is not. Additionally, Mamdani got the same tiny share of the vote that Mamdani did in ultra-Orthodox Jewish enclaves such as Borough Park and Williamsburg. Finally, though it’s geographically small and hard to see on the map, Mamdani did not run much ahead of Wiley in the very richest parts of the Upper East Side, near Central Park. This area is seriously old money and has a history of voting for more fiscally moderate candidates in local elections, so it’s no surprise they were possibly the most turned off by his socialist message.
2) Turnout surged in white, progressive areas
Even with around 10% of the vote left to count, turnout has already exceeded the Mayoral primary four years ago. However in large parts of New York, particularly Black and Asian areas, turnout is down, in some cases by a lot. It was white voters, and moreso progressive and young white voters, who turned out in record numbers. That strikingly blue part of the map, where turnout surged far more than anywhere else? We call that area the “Commie Corridor” and it’s where Mamdani got his highest share of the vote. Not a coincidence that it also experienced a turnout surge.
3) Mamdani crushed Cuomo with young voters
It can be hard to estimate how voters split by age using just election results, because age variations by precinct are often dominated by other variables, such as race & education. Here though, age is such a strong effect that it shines through even if you just do a simple citywide regression:
In areas where the average registered voter is 40, Mamdani was getting around 60% of the vote. Naively, this implies he was getting much more than 60% of the vote with under-40s, although we have to be careful with interpreting an ecological regression such as this. Also, many of the non-Mamdani voters in these young areas went for Brad Lander, rather than Andrew Cuomo, and will probably have ranked Mamdani second. I expect the age gradient in the final round of RCV between Mamdani and Cuomo to look even steeper. It is entirely possible to me that Mamdani will have won something crazy like 90% of people aged under 30, but it’s really hard to know for sure.
4) Mamdani struggled with Jewish voters
Practically every group that Mamdani struggled with—older voters, Black voters, conservative whites— saw anemic turnout on Tuesday. There simply wasn’t a big groundswell of opposition to him, despite the many millions spent on negative ads. The one exception to this, however, was Jewish voters. This demographic saw robust turnout and gave few votes to Mamdani, especially in the Upper East Side and Upper West Side, as well as ultra-Orthodox enclaves. If we narrow our view to just Manhattan, i.e., purposefully excluding these idiosyncratic ultra-Orthodox areas, we find a strong negative relationship between the Jewish share of the electorate, and Mamdani’s share of the vote:
Despite winning Manhattan overall, Mamdani did very poorly in the most Jewish neighborhoods, in many cases coming third to Cuomo and Lander.
Note: it’s pretty hard to estimate Jewish % by precinct, so these estimates are rough. See this Twitter thread for a detailed analysis of the various shortcomings of my estimates.
Overall this really was an election for the history books and I feel privileged to have been able to follow along and do a bunch of cool data work along the way. I hope the general election ends up being similarly eventful!


I haven't I'm afraid, don't have that data easily on hand, but I am very sure Mamdani support is correlated with public transport / biking / no cars
Curious since I wasn't paying attention to the 2021 election: will they post counts for every ballot ranking as well as the final round votes? Want to mess around with those numbers at some point.